Additional Projects
College Scorecard Data Explorer
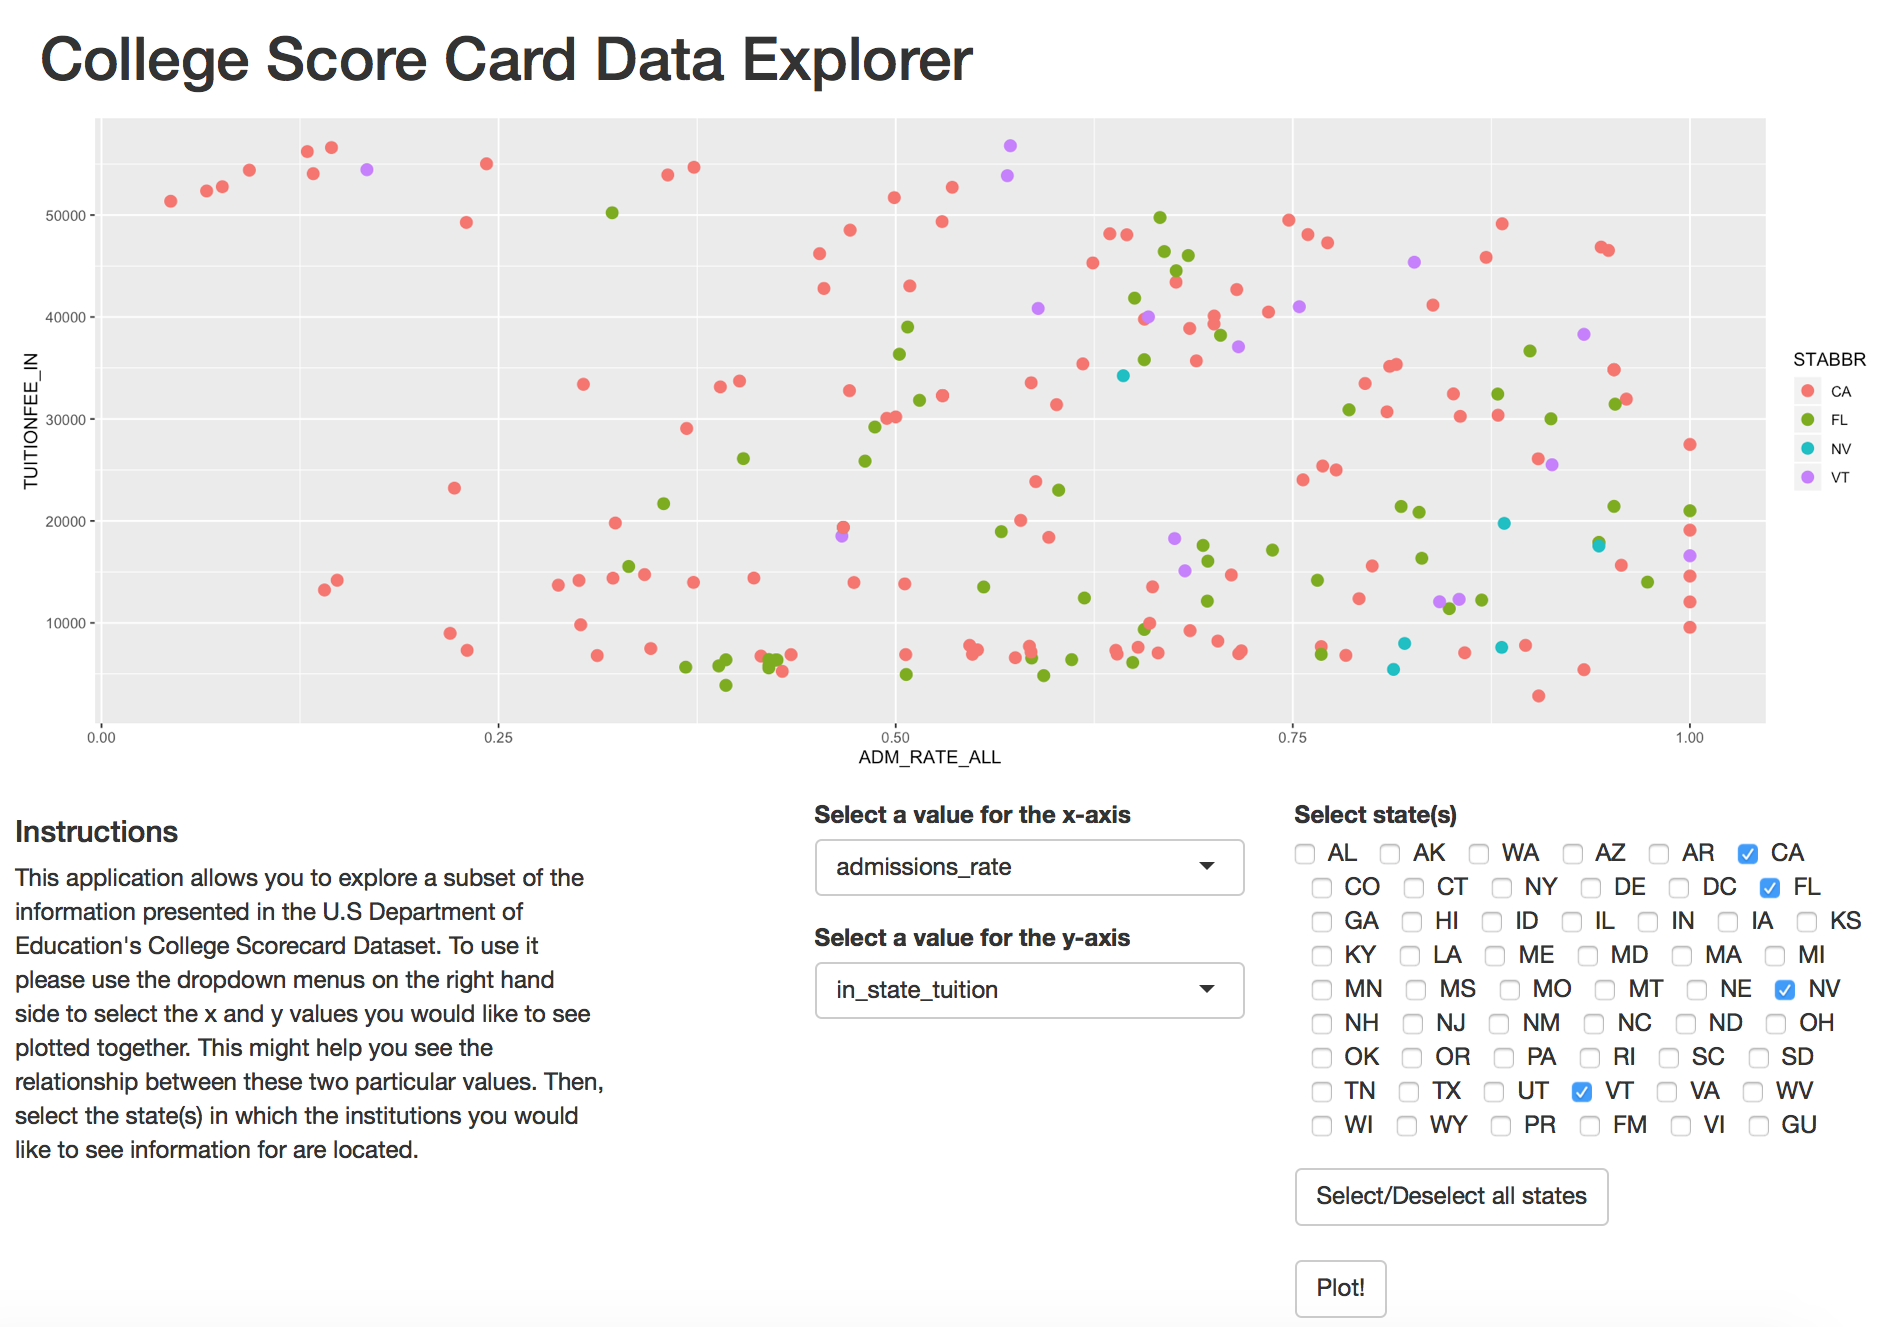
Motivation: Recently I found that the U.S Department of Education maintains a dataset called the College Scorecard Dataset, which contains aggregate information for various institutions of higher education in the U.S such as costs and admissions statistics. This information could be incredibly useful for students and families, yet it is difficult to parse through and the amount of information is overwhelming. Therefore, I wanted to create an easy way for someone interested in exploring the dataset to do so without having to sift through a large CSV file.
Description: I created an interactive web application using Shiny that allows users to create a scatter plot by selecting x and y values among four different variables related to admissions rate and cost: admissions rate, in-state tuition, out of state tuition, percent of students with federal loans, and percent of students with pell grant. The application also allows users to view data points only for certain states. A more detailed description of the process I followed to create the application can be found here.
Results: The application is an early stage working prototype. In the future I would like to work with college-bound students and their families to add features that would best serve their needs. View the code at this GitHub repository or play with the application here.
Technologies used: R, Shiny
Designing and Testing Causeway Interfaces
Motivation: MOOCs have allowed for greater dissemination of educational content, especially in computer science education. However, the kind of learning enabled by MOOCs does not provide students with the tacit knowledge and skills needed to perform expert-level work and solve real-world problems. These skills are best developed through experiential and apprenticeship learning. Yet, these opportunities are difficult to scale since they require a significant time commitment from mentors who oversee students and guide them through the learning process.
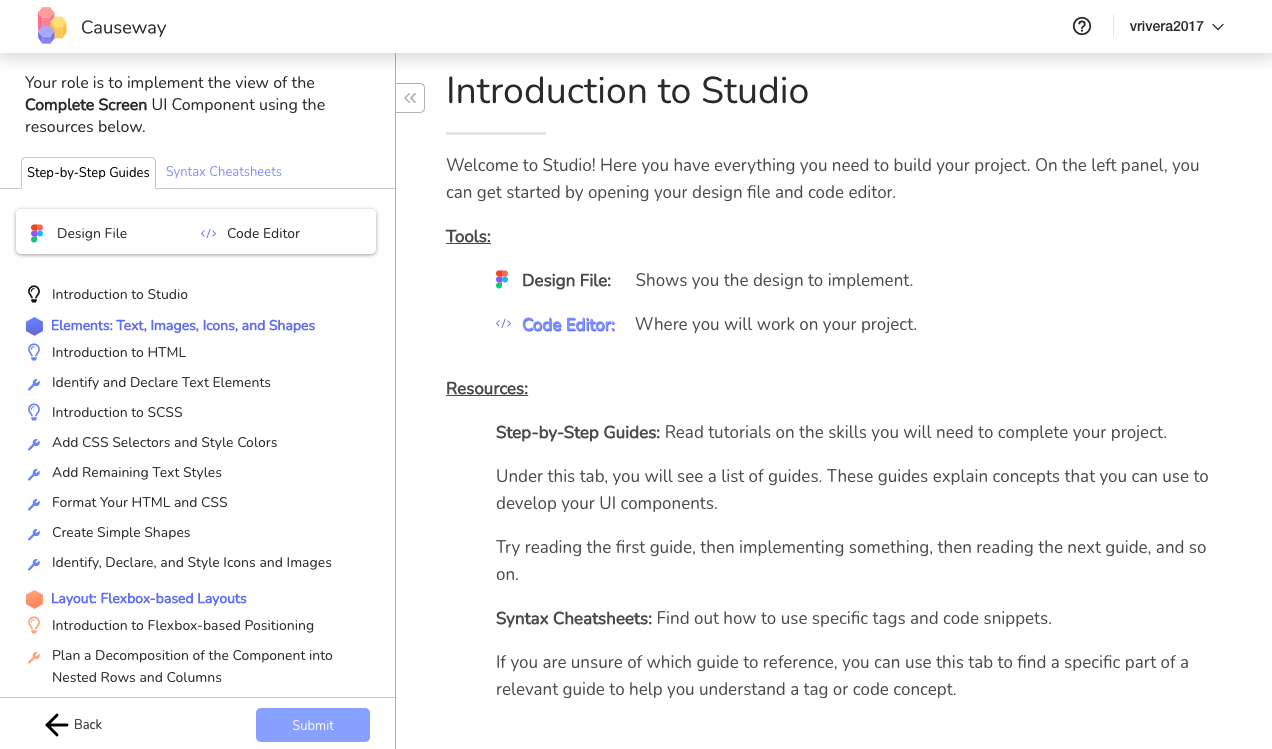
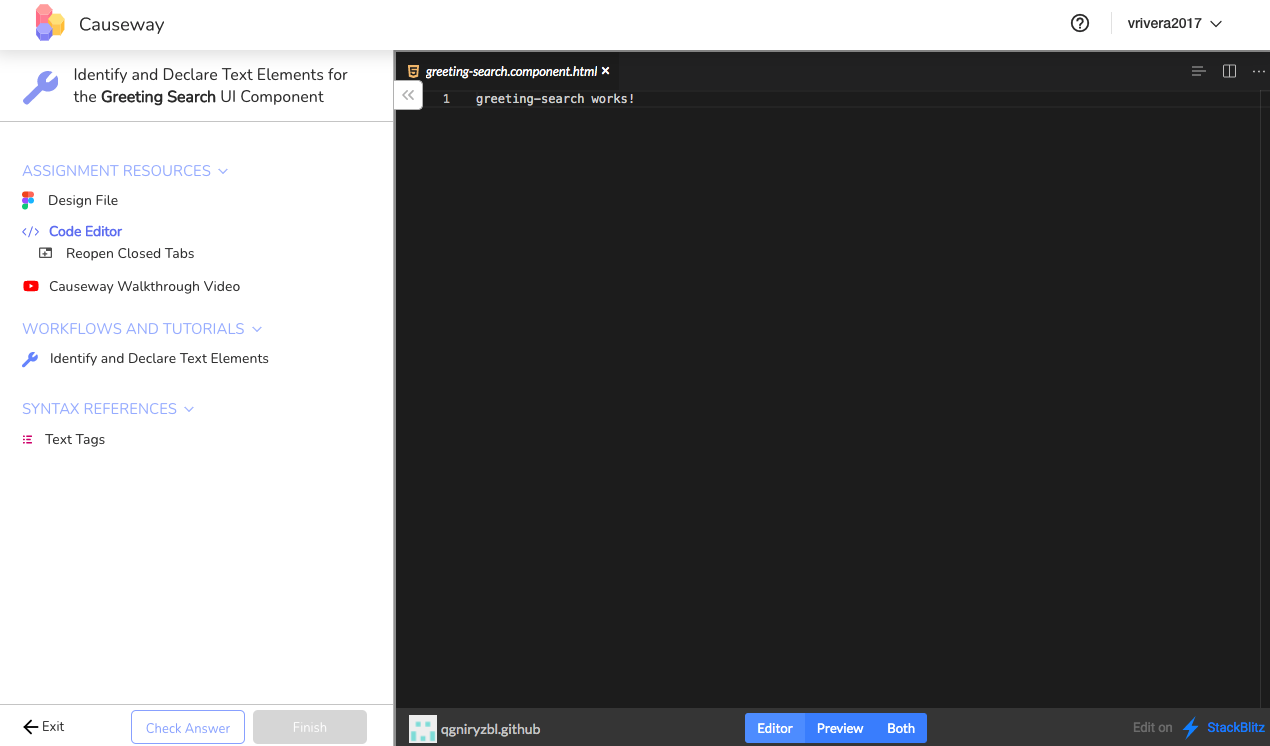
Description: To study how we might design online learning environments that support experiential and apprenticeship learning at scale, I have led the user testing and design iterations of two interfaces for Causeway, an online platform that enables students to learn web development by following a series of learning pathways as they work on real-world problems. Each of the interfaces provides learners with a series of guides they can use to learn web development concepts, which they immediately apply to build static web pages. The design of each interface and prescribed workflow models various ideas of apprenticeship learning theory from the education literature. A more detailed description of the two interfaces and my user testing process can be found here.
Results: The two interfaces are currently being used in a study where we investigate how to design these kinds of interfaces to support apprenticeship learning at scale in a way that lessens the need for individual mentors.
Methods: participant observations, usability tests, think-alound, participant interviews
ColorMe
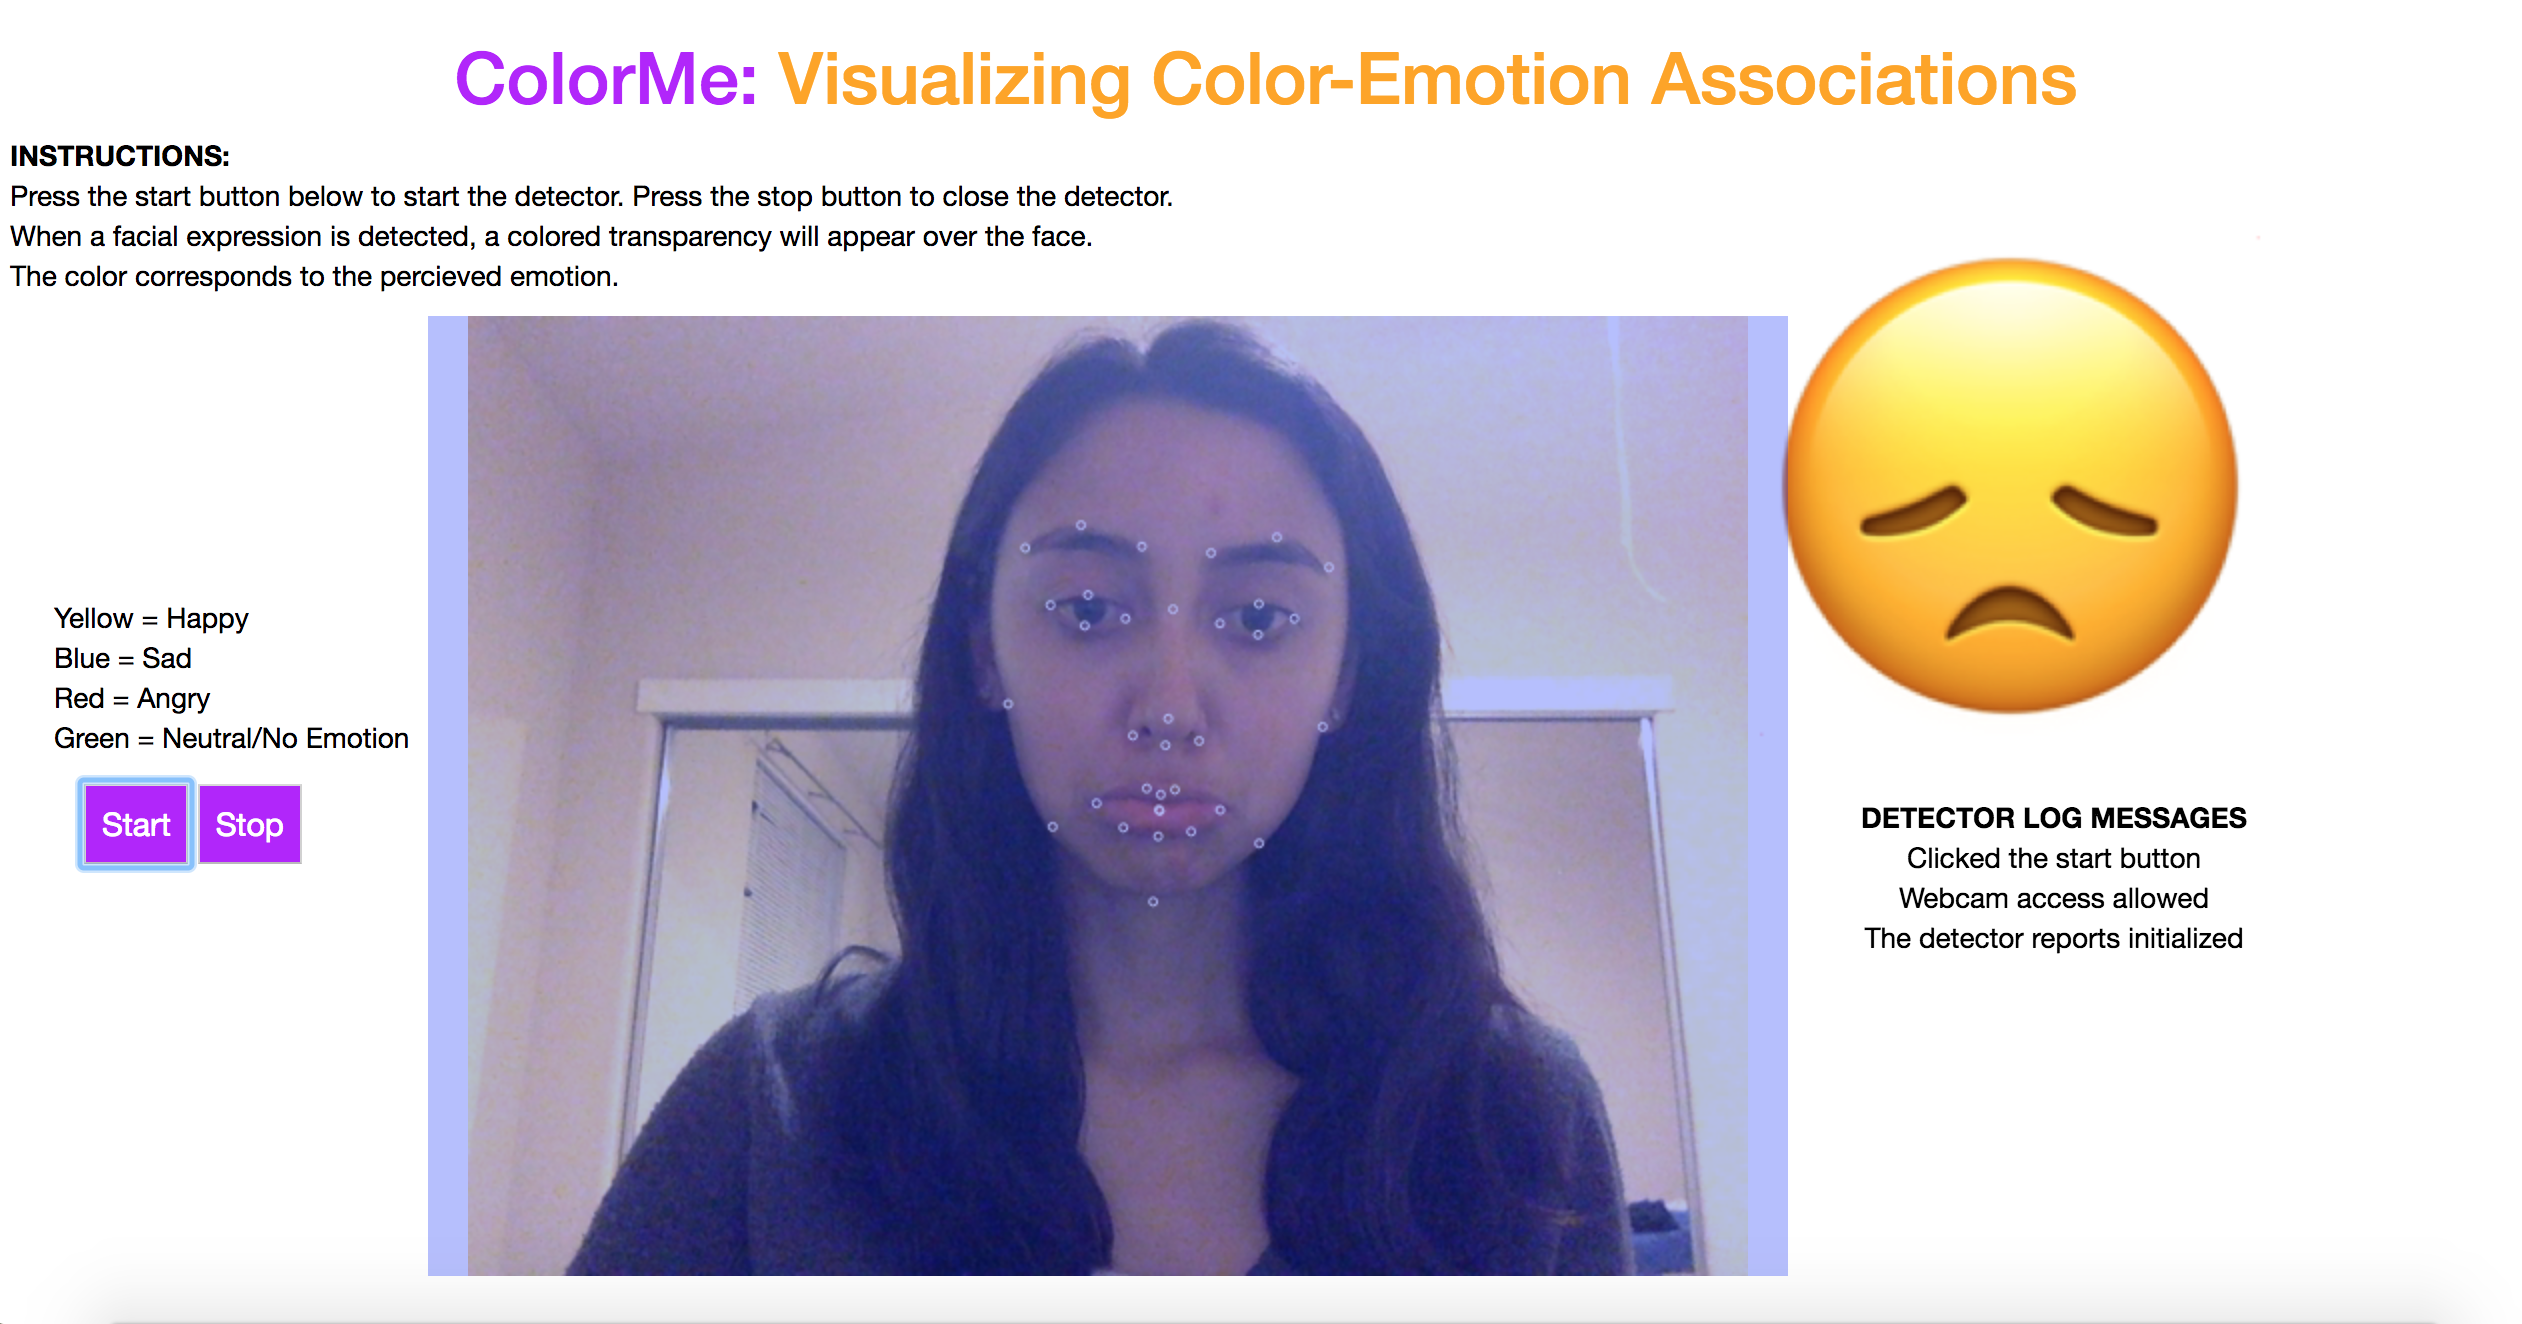
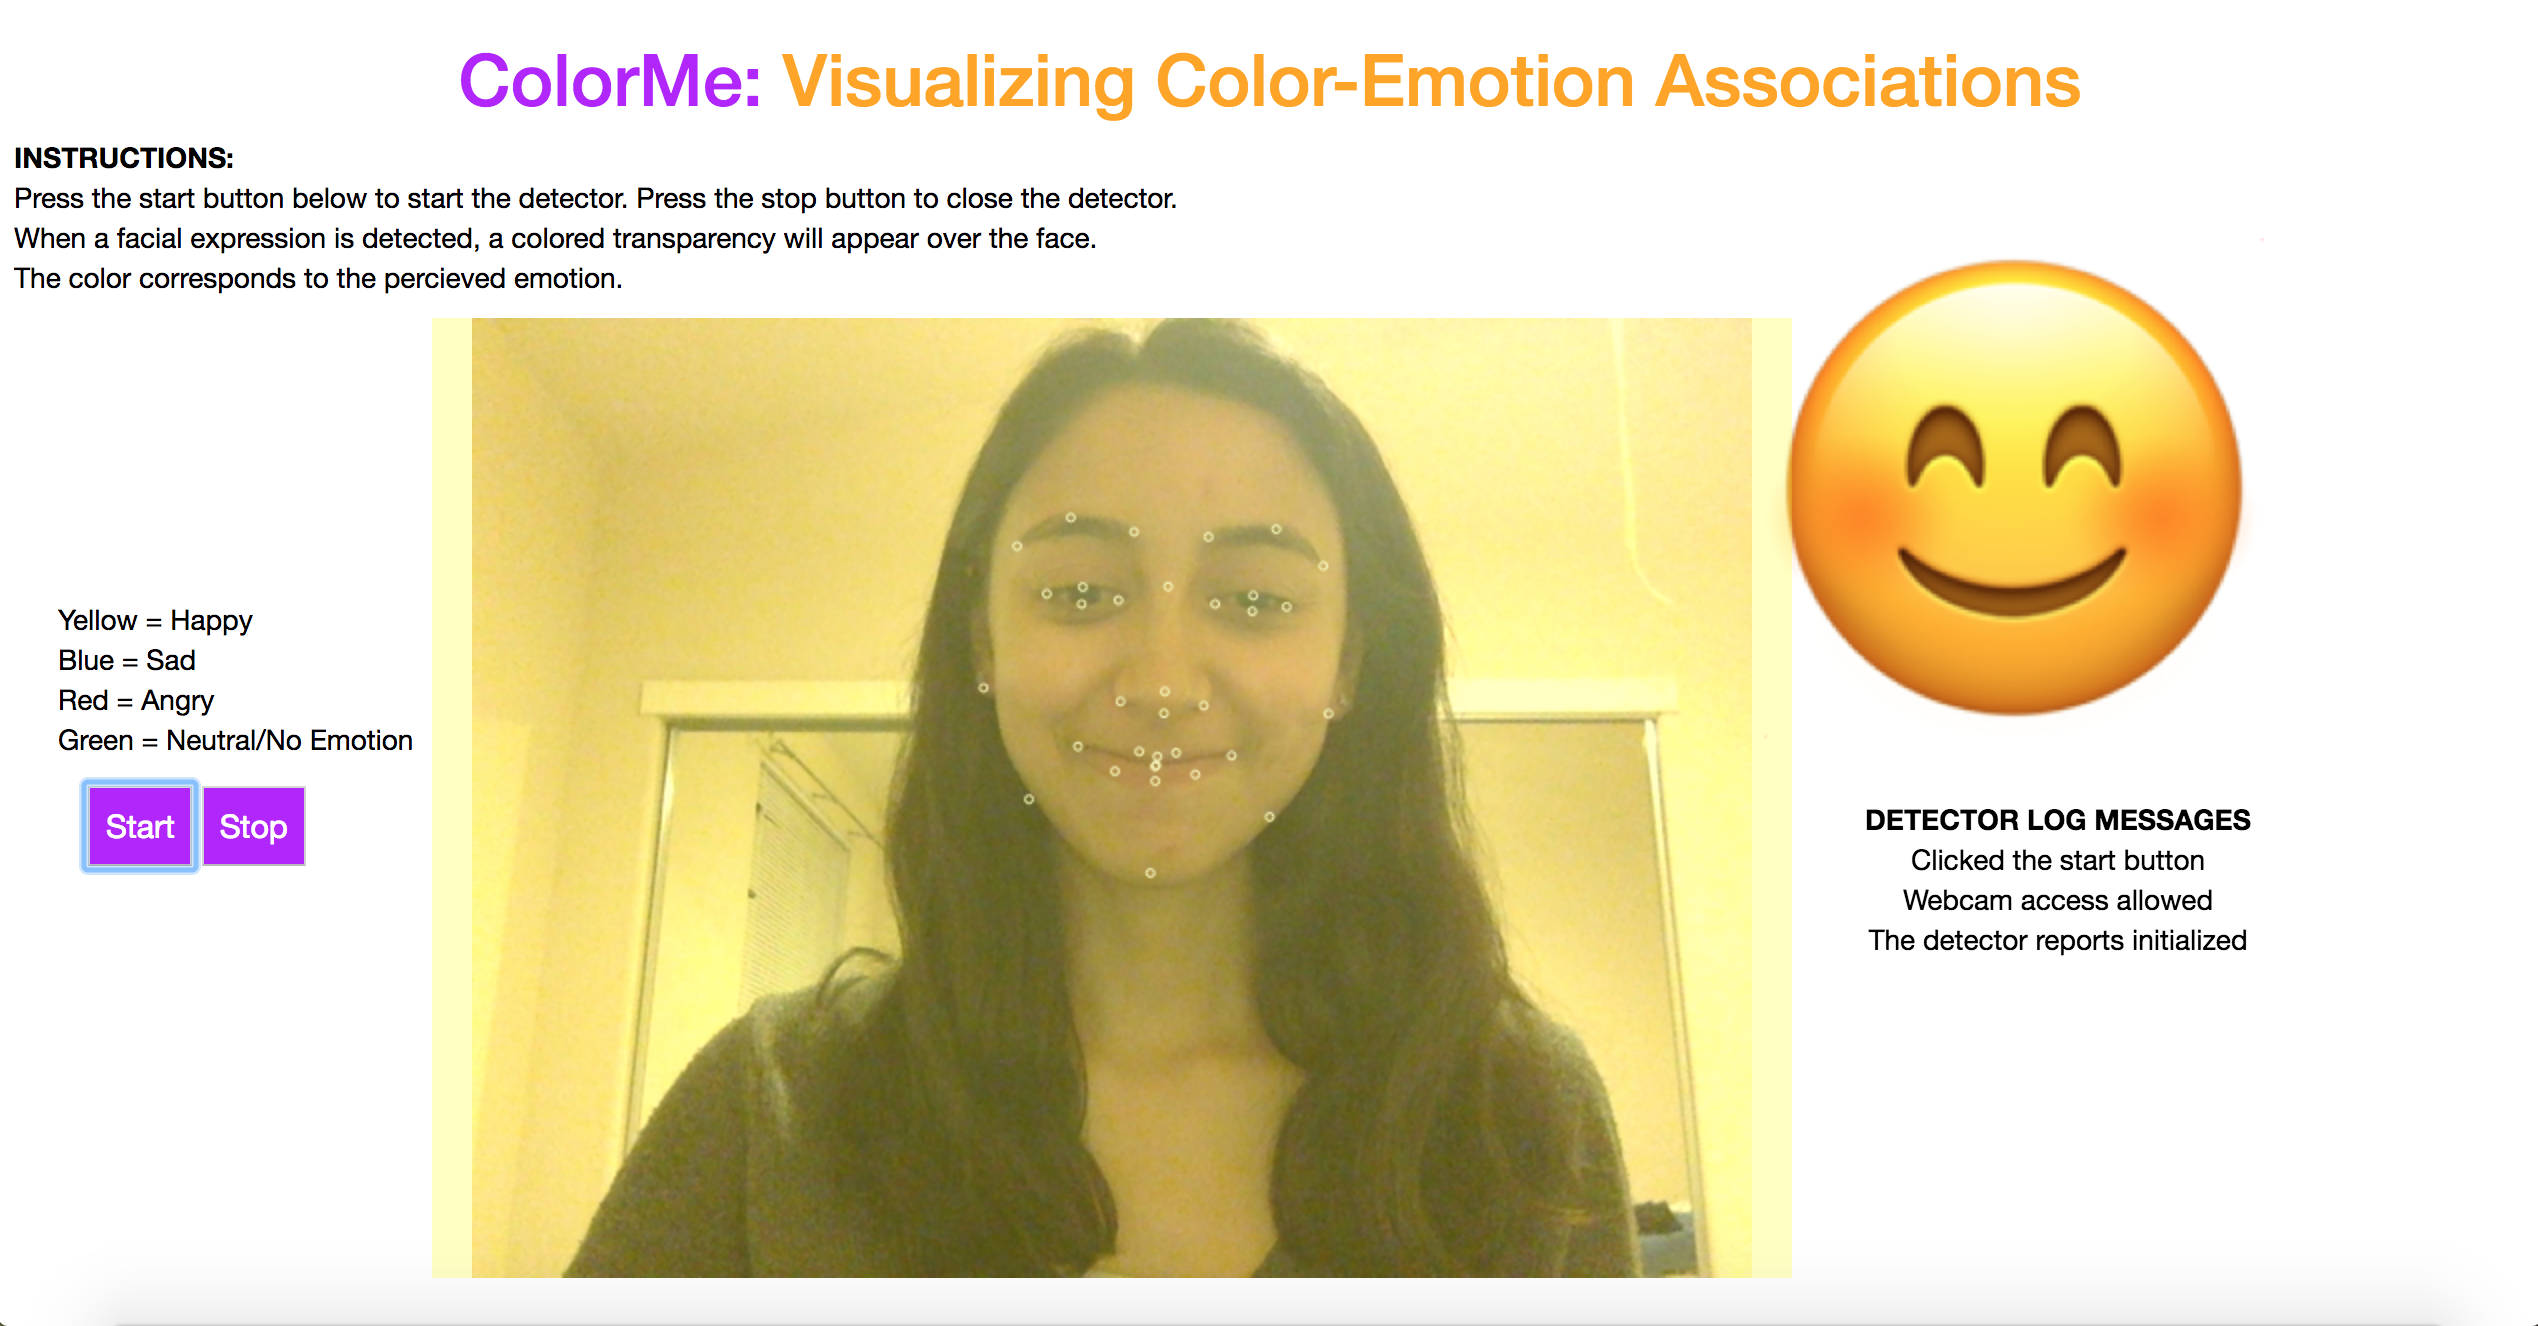
Motivation: Colors are often used to visually represent emotions. There have been numerous studies conducted in Human-Computer Interaction and Psychology to determine which colors people most often associate with specific emotions and how color can be used to evoke certain emotions as well. Beyond this, color is also a very powerful tool for data visualization, as it allows information to be represented in a concise and easy to understand format. One group of people that benefits from visual information is children with Autism Spectrum Disorders (ASD). Many children with ASD struggle to read facial expressions of emotion. This inspired the creation of ColorMe, a prototype tool that might be used to help children with ASD learn to read facial expressions of emotion.
Description: ColorMe is an application designed for the web that uses Affectiva’s emotion detection software to detect four emotions from users’ facial expressions using a webcam. Each emotion is represented visually using a color overlaid on top of the video feed and the corresponding emoji adjacent to the video feed display. The emotions supported by the prototype application are happy, sad, angry and neutral/no emotion. Code for the application is available in this GitHub repository.
Results: This prototype was completed as my final project for CMPS 261 (now CSE 261) Advanced Visualization at UC Santa Cruz in Spring 2018.
Technologies used: Affectiva, JavaScript, HTML/CSS